Present with Data Playbook
Build clear presentations and communicate with confidence
Too often, the problem isn't the idea but the way it's presented. This interactive playbook is built to transform the way you present data so your ideas get heard & acted on.
Inside this playbook, you'll keep coming back to:
• 01 Data: frameworks for clear, impactful data visualizations
• 02 Presentation: strategies to make insights land
• 03 The Resources: palettes, checklists, and templates
Hear from Happy Customers

“It's super helpful, interactive, and aesthetically pleasing.
I applied the tips to my presentations and dashboards at work, and now the entire board and management team want me to do their presentations too.”
— Rita
“I am genuinely impressed by the quality of this guide.
It solves the (very) difficult problem of how to use data to communicate effectively and I can apply the concepts and use the tools very quickly after starting to read it.”
— Joseph
“It's practical, well illustrated, and easy to read.
Really solid work. Clear ideas, great flow, and useful structure.”
— Etienne
...and from our lovely community of 300,000+ professionals


WHAT THIS PLAYBOOK WILL TEACH YOU
Skills that turn strong analysis into clear decisions and lasting influence
Data Storytelling Framework
Learn how to shape complex findings into a simple story that keeps leaders focused on the path from insight to action.
Visual Clarity Principles
Use design techniques that highlight the main message, remove noise, and make your charts easy to read in seconds.
Audience-Centered Communication
Practice shifting your language, tone, and framing so your work resonates with any audience and your ideas get heard.
01 THE DATA
1.1 Pick the Right Chart
Match your message to the format that makes it impossible to miss.
1.2 Avoid Credibility Killers
Spot and cut the mistakes that quietly sink trust.
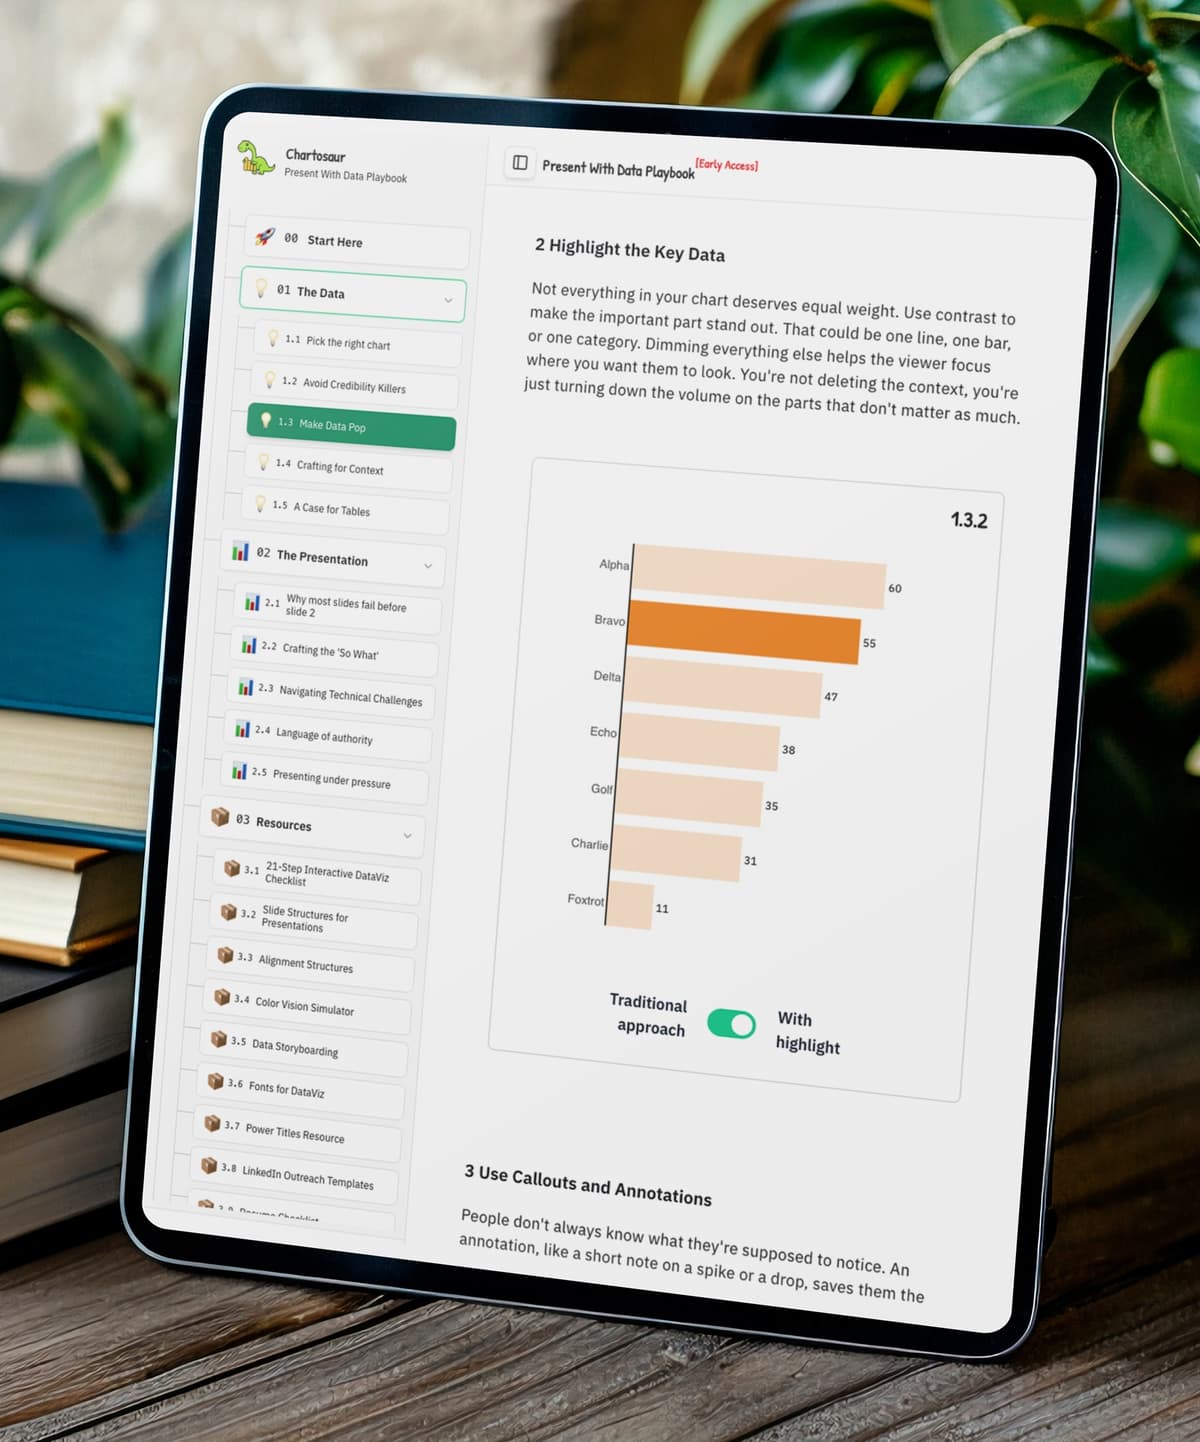
1.3 Make the Data Pop
Guide attention so your audience sees what matters first.
1.4 Creating for Context
Shape every visual around who's in the room and what they need.
1.5 A Case for Tables
Why sometimes the clearest move isn't a chart at all.
1.6 Guide the Eye[ new ]
Steer attention to the zone where the story actually lives.
1.7 Small Multiples[ new ]
Break complexity into a guided walkthrough.
Baseline Sensitivity Demo
More misleading, exaggerates differences
De-jargon Tool Demo
De-jargon this sentence
Stakeholder reports often decision delays because dashboards highlight trends, understate across , and features .
02 THE PRESENTATION
2.1 Why Most Slides Fail Before Slide 2
Frame the room fast or lose them for the rest of the deck.
2.2 Crafting the "So What"
Make every slide earn its place by leading with purpose.
2.3 Navigating Technical Challenges
Keep it clear for mixed rooms without losing the experts.
2.4 The Language of Authority
Speak in a way that builds trust and makes insight land.
2.5 Presenting Under Pressure
Handle pushback with composure and turn it into credibility.
2.6 Re-engaging a Lost Audience
Tools and strategies to recover audience attention.
03 RESOURCES
3.1 Interactive 21-Step DataViz Checklist
A complete checklist to review your charts and ensure every visualization is polished and credible.
3.2 Slide Structures for Presentations
Proven layouts to make complex insights flow clearly from start to finish.
3.3 Alignment Structures
Simple frameworks to align your message with audience priorities and decision-making needs.
3.4 Color-Vision Simulator
Instantly test your visuals to ensure accessibility and readability for every audience member.
3.5 Data Storyboarding
Plan your presentation like a movie script so your analysis unfolds as a compelling story.
3.6 Fonts for DataViz
Curated font pairings that maximize clarity, professionalism, and impact in charts and slides.
3.7 Power Titles Resource
Headline formulas that turn bland slide titles into persuasive executive-level messaging.
3.8 LinkedIn Outreach Templates
Ready-to-use scripts to connect with peers, leaders, and hiring managers in the data world.
3.9 Resume Checklist
Ensure your resume highlights data impact and presentation skills that employers value.
3.10 Color Palettes
Professional, presentation-ready palettes designed for clarity and executive communication.
Power Titles (Preview)
Power Titles
If you want to turn your data into a story with curated powerful words that can help you craft more effective, attention-grabbing titles for your charts and visualizations.
| Theme | Power Words (click to copy) |
|---|---|
| Strength | |
| Growth | |
| Success | |
| More rows available in full view | |
PERFECT FOR ANALYSTS, EXECUTIVES & CONSULTANTS
A tool-agnostic playbook you can apply no matter your stack, platform, or presentation tools.
For Analysts
Build Career Momentum
Turn solid analysis into recognition, promotions, and influence.
Get Heard in the Room
Present data so decision-makers pay attention and take action.
Present With Confidence
Share data without second-guessing yourself or worrying about hidden mistakes.
For Executives
Win Stakeholder Support
Present data with authority so your ideas gain backing instead of pushback.
Align Your Team Quickly
Use structured storytelling to get everyone on the same page fast.
Turn Data Into Decisions
Frame information so meetings end with clarity and action instead of confusion.
For Consultants
Win Client Trust
Present data with clarity and authority so recommendations get adopted.
Drive Decisions That Stick
Deliver data stories that compel clients to act instead of shelving your work.
Command the Room
Be the consultant clients listen to and follow with confidence.
FREQUENTLY ASKED QUESTIONS
Find answers to common questions about the Present with Data Playbook and get the support you need.
Hi, I'm Chartosaur!
As your friendly guide to data storytelling, I'm passionate about helping professionals transform their data presentations from overlooked reports into compelling narratives that drive decisions.
I spent years in academia, startups, and major corporations, and I noticed a pattern. The people who advanced were not always the ones with the deepest analysis. They were the ones who could present their work in a way that leaders quickly understood and acted on.
This playbook shares the lessons from those experiences, showing how to take solid analysis and present it in a way that earns attention, builds trust, and moves both ideas and careers forward.
Ready to make your data work harder for you? Let's turn your insights into influence.