When Do Mental Health Disorders Begin?
October 29, 2026 • 4 min read
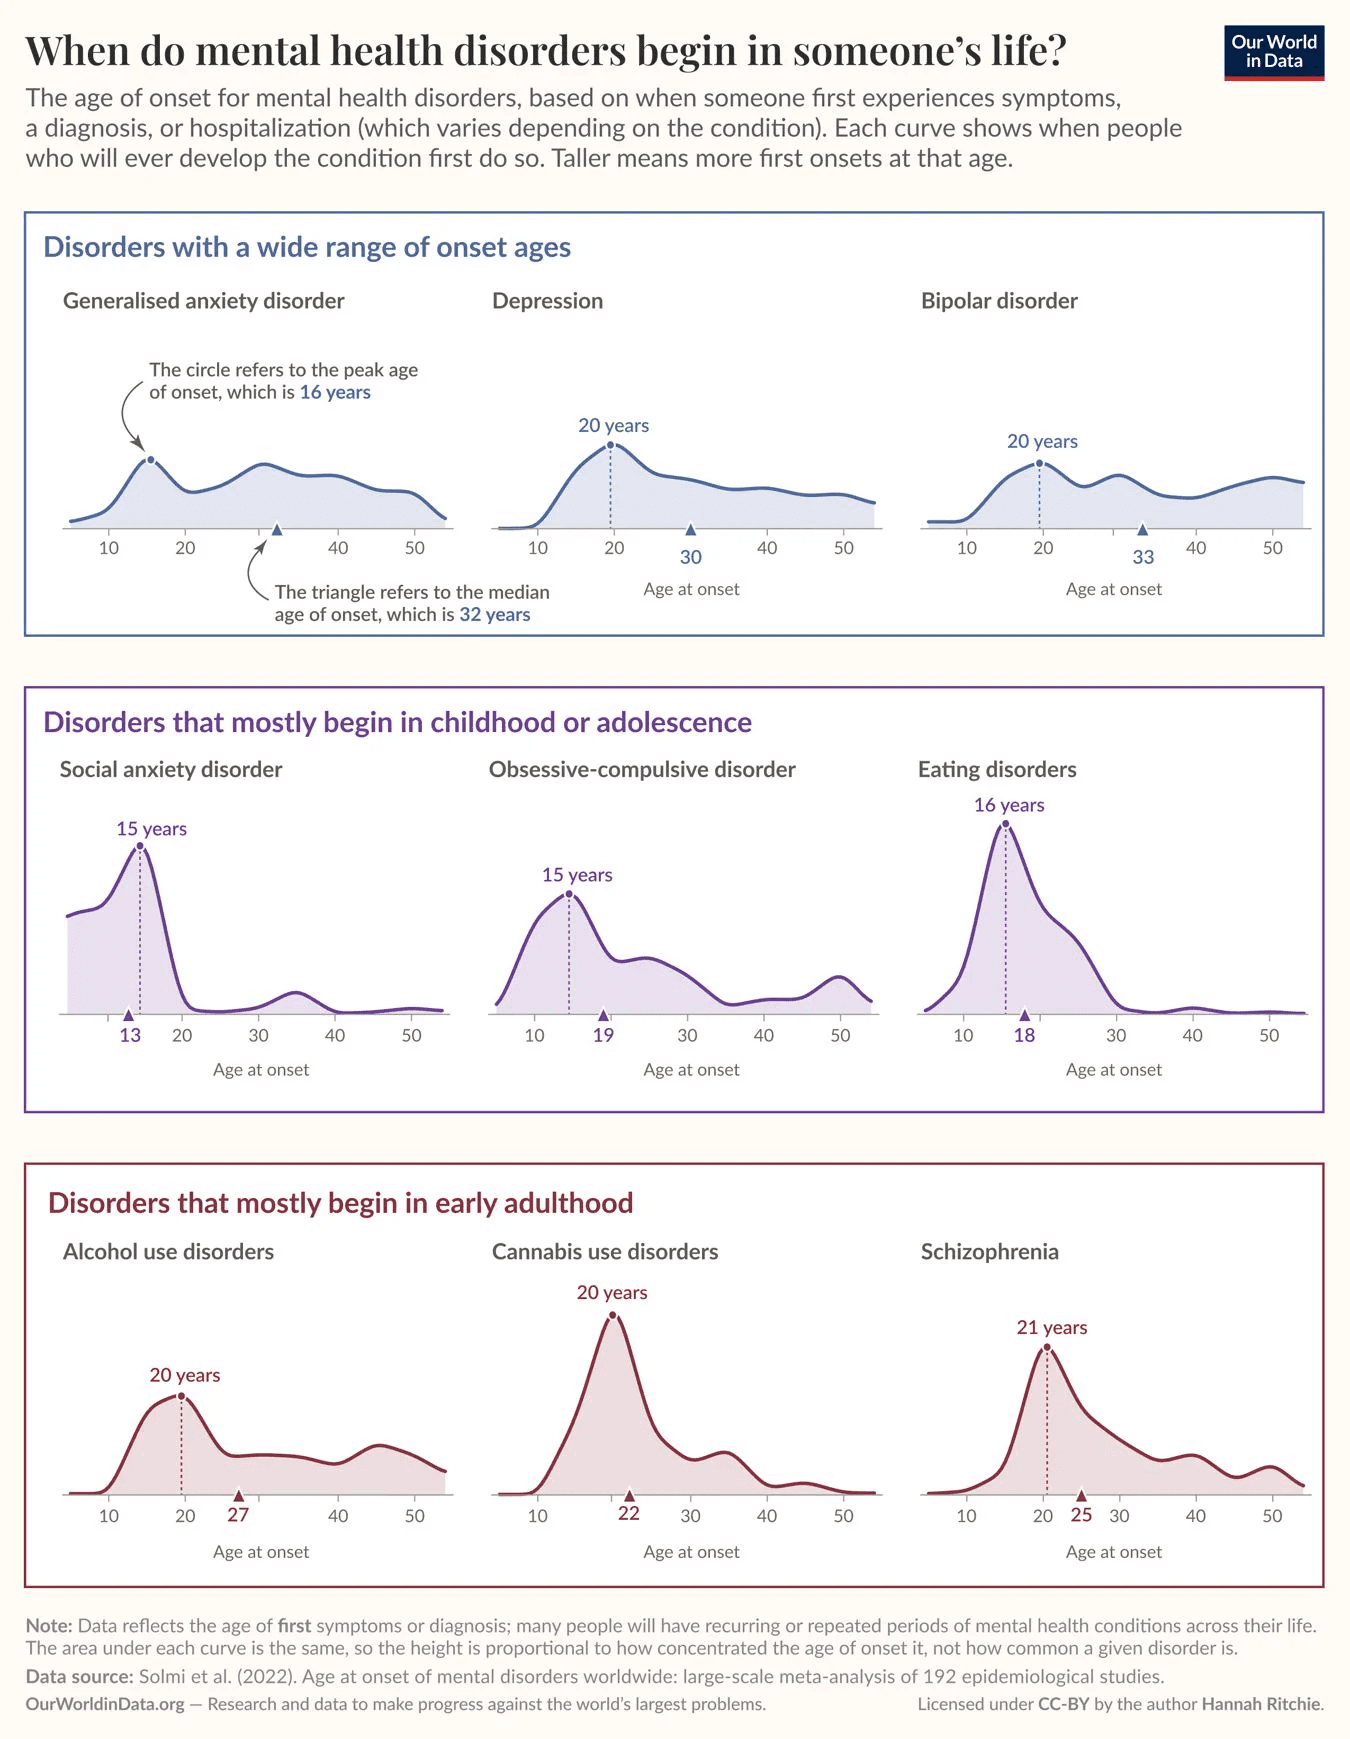
I recently came across this chart from Our World in Data showing when mental health disorders tend to first appear in people's lives.
It uses data from a 2022 meta-analysis that combined 192 epidemiological studies from around the world, and covers nine disorders, from generalised anxiety and depression to eating disorders and schizophrenia. Each curve shows the ages at which people who will ever develop that condition first do so. Depending on the condition, that's based on when they first had symptoms, got a diagnosis, or were hospitalized.
Reading the chart
Before getting into the data, there are two design choices to understand about how this chart is put together: how it's grouped, and what the markers mean.
First, there's quite a lot of information here, but separating the disorders into individual charts and grouping them by their general patterns makes it much easier to follow what's going on than if you'd just put all nine distributions on the same chart.
The three rows are organized around when these disorders tend to first appear. The top row covers disorders with a much wider range of onset ages, while the other two focus on those that mostly begin in childhood or adolescence and early adulthood. I also like how they've used a different color for each group, keeping it consistent across the headings, borders, and curves.
They've also been careful to keep the x-axis age scale consistent across the small multiples. It's an easy detail to overlook, but using different scales could make some distributions look much narrower or more spread out than they actually are, giving readers a misleading impression of the differences between them.
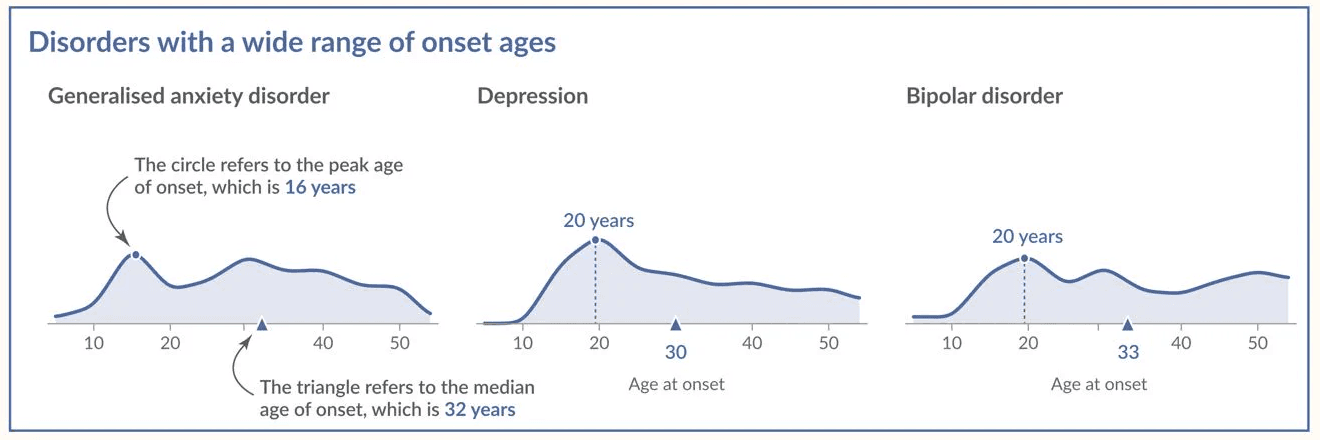
Second, there's the circle and triangle on each chart. The circle and dotted line mark the peak age of onset, while the triangle marks the median. For example, generalised anxiety disorder peaks at 16, but has a median of 32.
I think they've handled these annotations quite well. The first chart in the top left explains what both markers mean, rather than having a separate legend you need to keep referring back to. You sometimes hear designers talk about F and Z shaped reading patterns, where people generally start in the top left before moving across and down the page, so that makes it a sensible place to explain them.
Depression, bipolar disorder, alcohol use disorders, and cannabis use disorders all have the same peak onset age of 20, but their distributions look quite different. The medians are 22 for cannabis use disorders, 27 for alcohol use disorders, 30 for depression, and 33 for bipolar disorder. I like having both numbers marked directly on the charts, especially when the peak ages are identical.
The shape of the curves
Once you know how to read it, the curves themselves are worth spending some time on. The darker lines with the lighter fill underneath work quite nicely here, especially when you start looking at the individual distributions. In the top row, for example, there's relatively little onset before age 10, but after that the curves stay fairly flat across several decades. Compare that with eating disorders or cannabis use disorders, where there's a much sharper peak followed by a fairly steep decline.
What I'd be careful with
One thing I'd be cautious about is how people interpret the height of the curves. Even though the title makes it pretty clear what we're looking at, I've seen people mistake taller peaks for larger numbers of people. That's not the case here, since the area under each curve is the same. A taller peak just means that people who develop that disorder tend to develop it within a narrower range of ages, not that more people have the disorder.
